
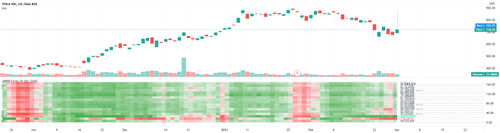
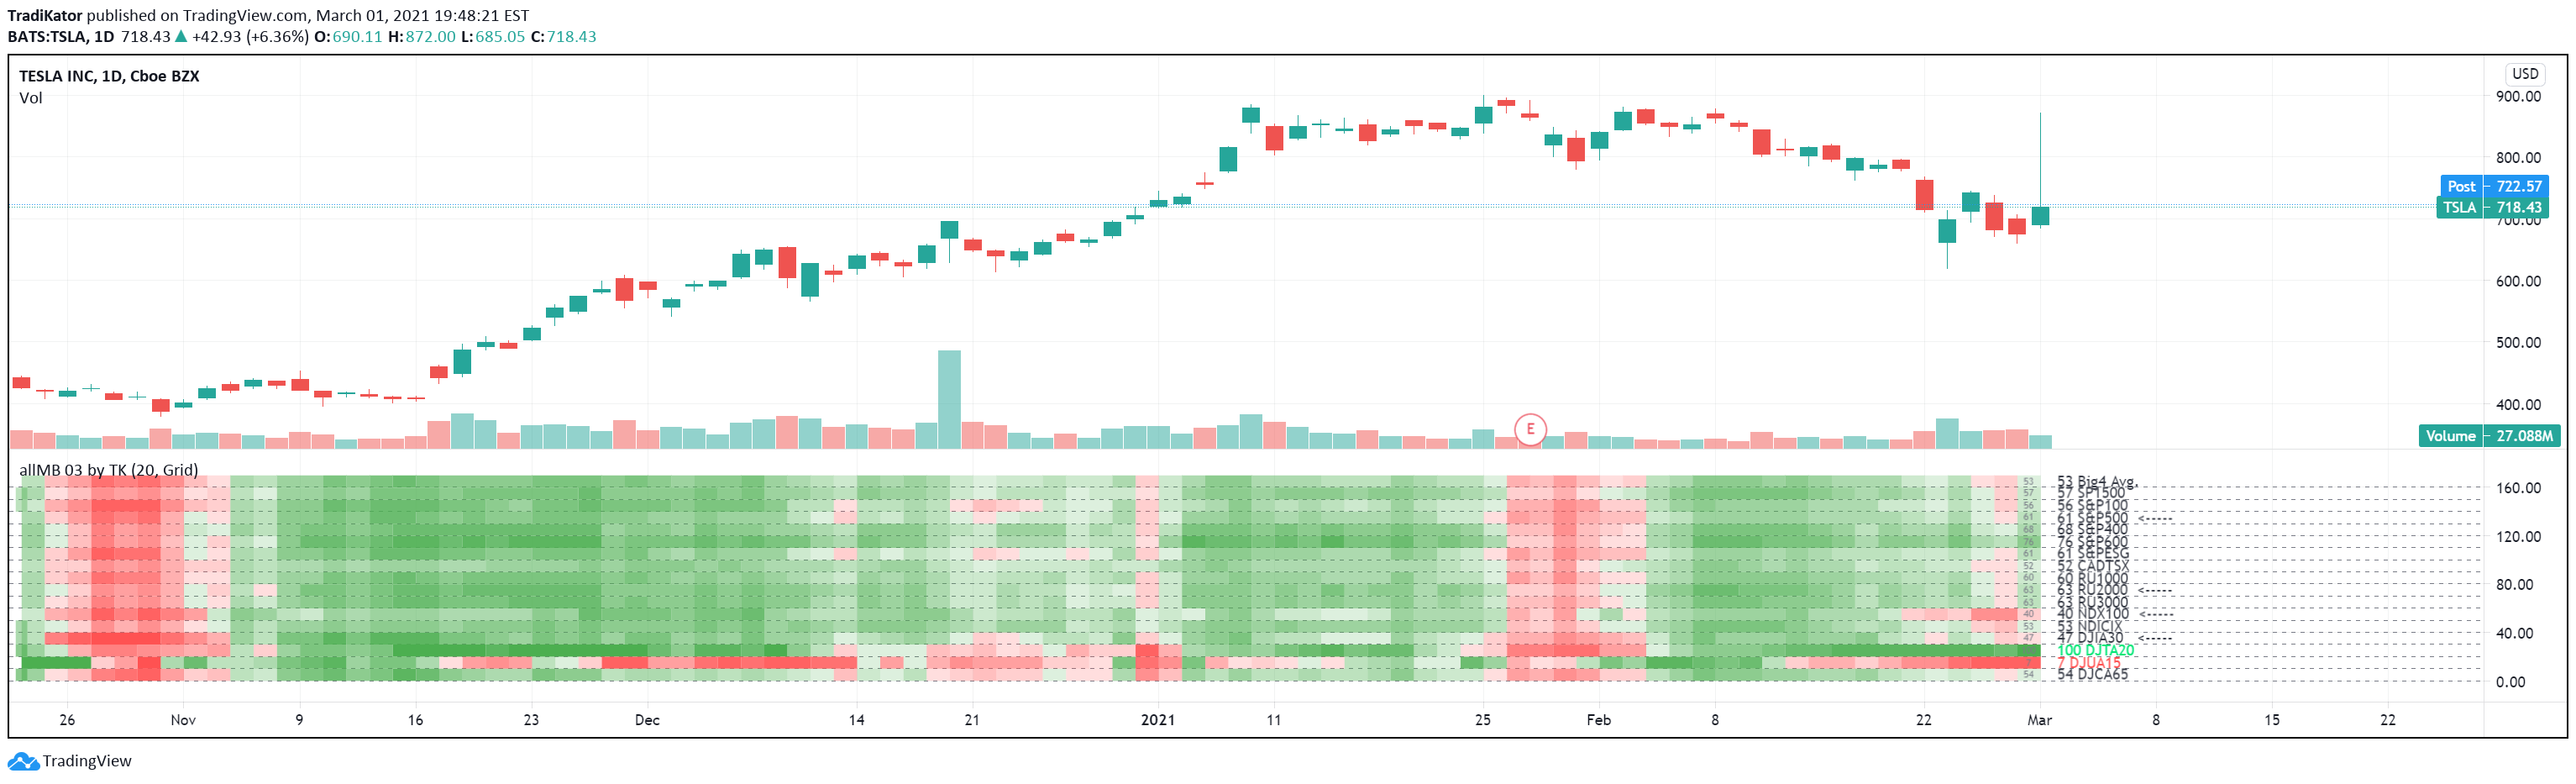
TradiKator 03 All Market Breadth ( allMB 03 by TK )is a visual indicator that plots All NA Market Breadth ( the percentage securities for all North American main stock exchange index's that is above a certain SMA line ).
Market breadth indicates the wave-induced motion of the whole market.
Q&A
Function and Setting
1.
15 index and 1 avg . or sum.
CADTSX = CANANDA TSX
S&P100 = S&P MEGA CAP 100
S&P500 = S&P LARGE CAP 500 *including S&P100
S&P400 = S&P MIDDLE CAP 400
S&P600 = S&P SMALL CAP 600
SP1500 = S&P 1500 * = S&P500 + S&P400 + S&P600
S&PESG = S&P ESG
NDX100 = NASDAQ 100
NDXCOM = NASDAQ COMPOSITE
RU2000 = RUSSELL 1000 * LARGE and MIDDLE CAP * including S&P500
RU2000 = RUSSELL 2000 * SMALL CAP
RU3000 = RUSSELL 3000 * = RUSSELL 1000 + RUSSELL 2000
DJIA30 = DOW JONES INDUSTRIAL AVERAGE 30
DJTA20 = DOW JONES TRANSPORTATION AVERAGE 20
DJUA15 = DOW JONES UTILITY AVERAGE 15
DJCA65 = DOW JONES COMPOSITE AVERAGE 65 *= DJIA30 + DJTA20 + DJUA15
You can open this indicator by multi times to check the different settings with "above ? SMA" in same time like the picture shows "above 50 days , above 20 days and above 20 days plot in lines"
Also, it is possible to combine this indicator with multiple setting to give the sum of the different "above? SMA"'s the result.
1.
6 choices for above ? SMA
Above 5 days, Above 20 days, Above 50 days, Above 100 days, Above 150 days or Above 200 days,
2.
2 methods to visualize the study result
Colorful grid, Green = more securities above ? SMA , Red = more securities below ? SMA
Line plot, High = more securities above ? SMA , Low = more securities below ? SMA