
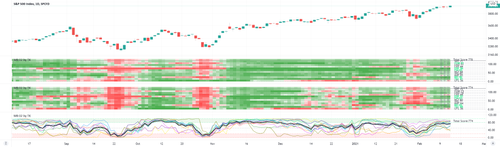
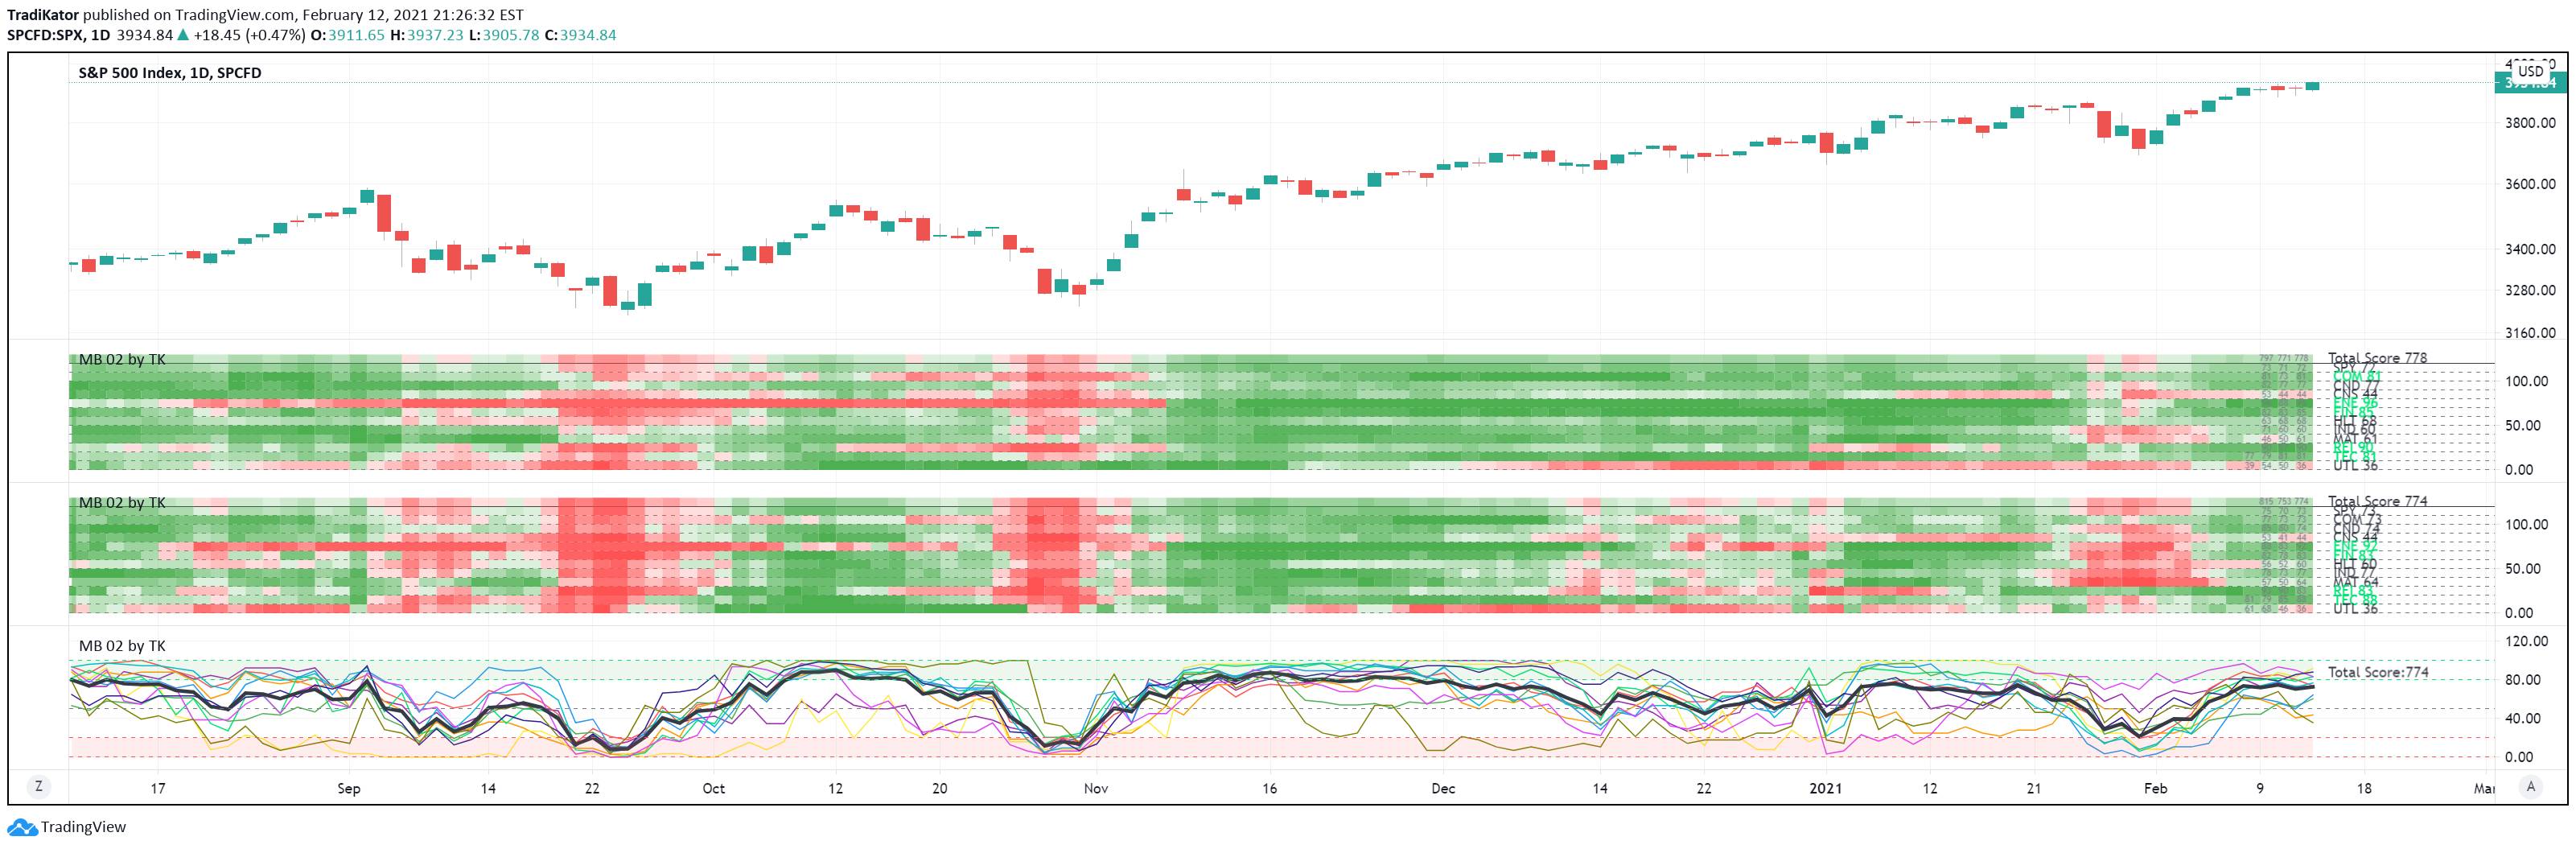
TradiKator 02 S&P500 Market Breadth ( MB 02 by TK ) is a visual indicator that plots S&P500 Market Breadth ( the percentage of S&P500 securities that is above a certain SMA line ).
Market breadth indicates the wave-induced motion of the whole market.
Q&A
Function and Setting
1. 11 sectors for the S&P500's securities
You can open this indicator by multi times to check the different settings with "above ? SMA" in same time like the picture shows "above 50 days , above 20 days and above 20 days plot in lines"
Also, it is possible to combine this indicator with multiple setting to give the sum of the different "above? SMA"'s the result.
2. 6 choices for above ? SMA
Above 5 days, Above 20 days, Above 50 days, Above 100 days, Above 150 days or Above 200 days,
3. 2 methods to visualize the study result
Colorful grid, Green = more securities above ? SMA , Red = more securities below ? SMA
Line plot, High = more securities above ? SMA , Low = more securities below ? SMA
TradiKator 02 S&P500 市场宽度