
Q&A
Q1.Why Moving Average ?
As LEI & LoneCapital explained moving average is indicating market capitalized cost moving. If you are a trend following trader, you should participate in upside while sidestepping downside. You need a indicator that help you to make money while prices are rising, then exit when they are falling.
A classical approach is the moving average strategy.
Nevertheless as efficient-market hypothesis (EMH) states that asset prices will reflect all available information.
The smart trader should focus on price moving i.s.o. reading all available information which is not practical.
Q2.What is Moving Average ?
As the name implies, the moving average is an average of a price's movement over time.
The exponential moving average (EMA) on the other hand gives greater weight to more recent price action.
Q3.What are the Period Moving Average based on ?
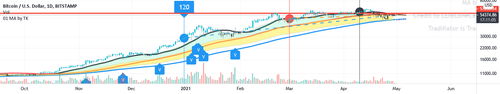
The default Moving Average Period setting are based on LEI & LoneCapital defined Short term 20 (days in month), Mid term 60 (days in quarter), Long term 120 (days in half year).
We use 3 colors to represent these 3 periods.
Black as Short term , Red as Mid term , Blue as Long term
You will see same color scheme in our indicators.
Of cause you can change the default setting to switch to your
favorite Moving Average Period. How to do it is listed in setting.
Function and Setting
MA period setting
•
"Adjust All MA Period"
Users can increase or decrease all 3 period in the same time. For example, input "-1" , you will have 3 periods as "19","59","119"
•
"Fix the M_MA=3*S_MA,L_MA = 6*S_MA (overwrite below 2 settings)"
It will fix the Mid period as 3 times of short, Long period as 6 times of short. Meanwhile the separated setting for Mid and long will be ignored.
•
"3 period separated settings"
Please disable the "fix ..." setting for individual 3 periods
•
"Source"
Allow user switch used source from "close" to any other data source like"hl2","hlc3" and etc.
Deduction price Setting
•
Will show 3 deduction price. Please disable the "Show Angle ..." before enable this switch.
•
"Arrow on Slope (Deduction vs Today Which is higher)"
Will show 3 arrows aim to the higher price between Deduction and Today.
Also the dashed slope line will change to solid line. It helps when Deduction is very close to Today
Angle for slope line --> Killer feature
•
"Show Angle ..."
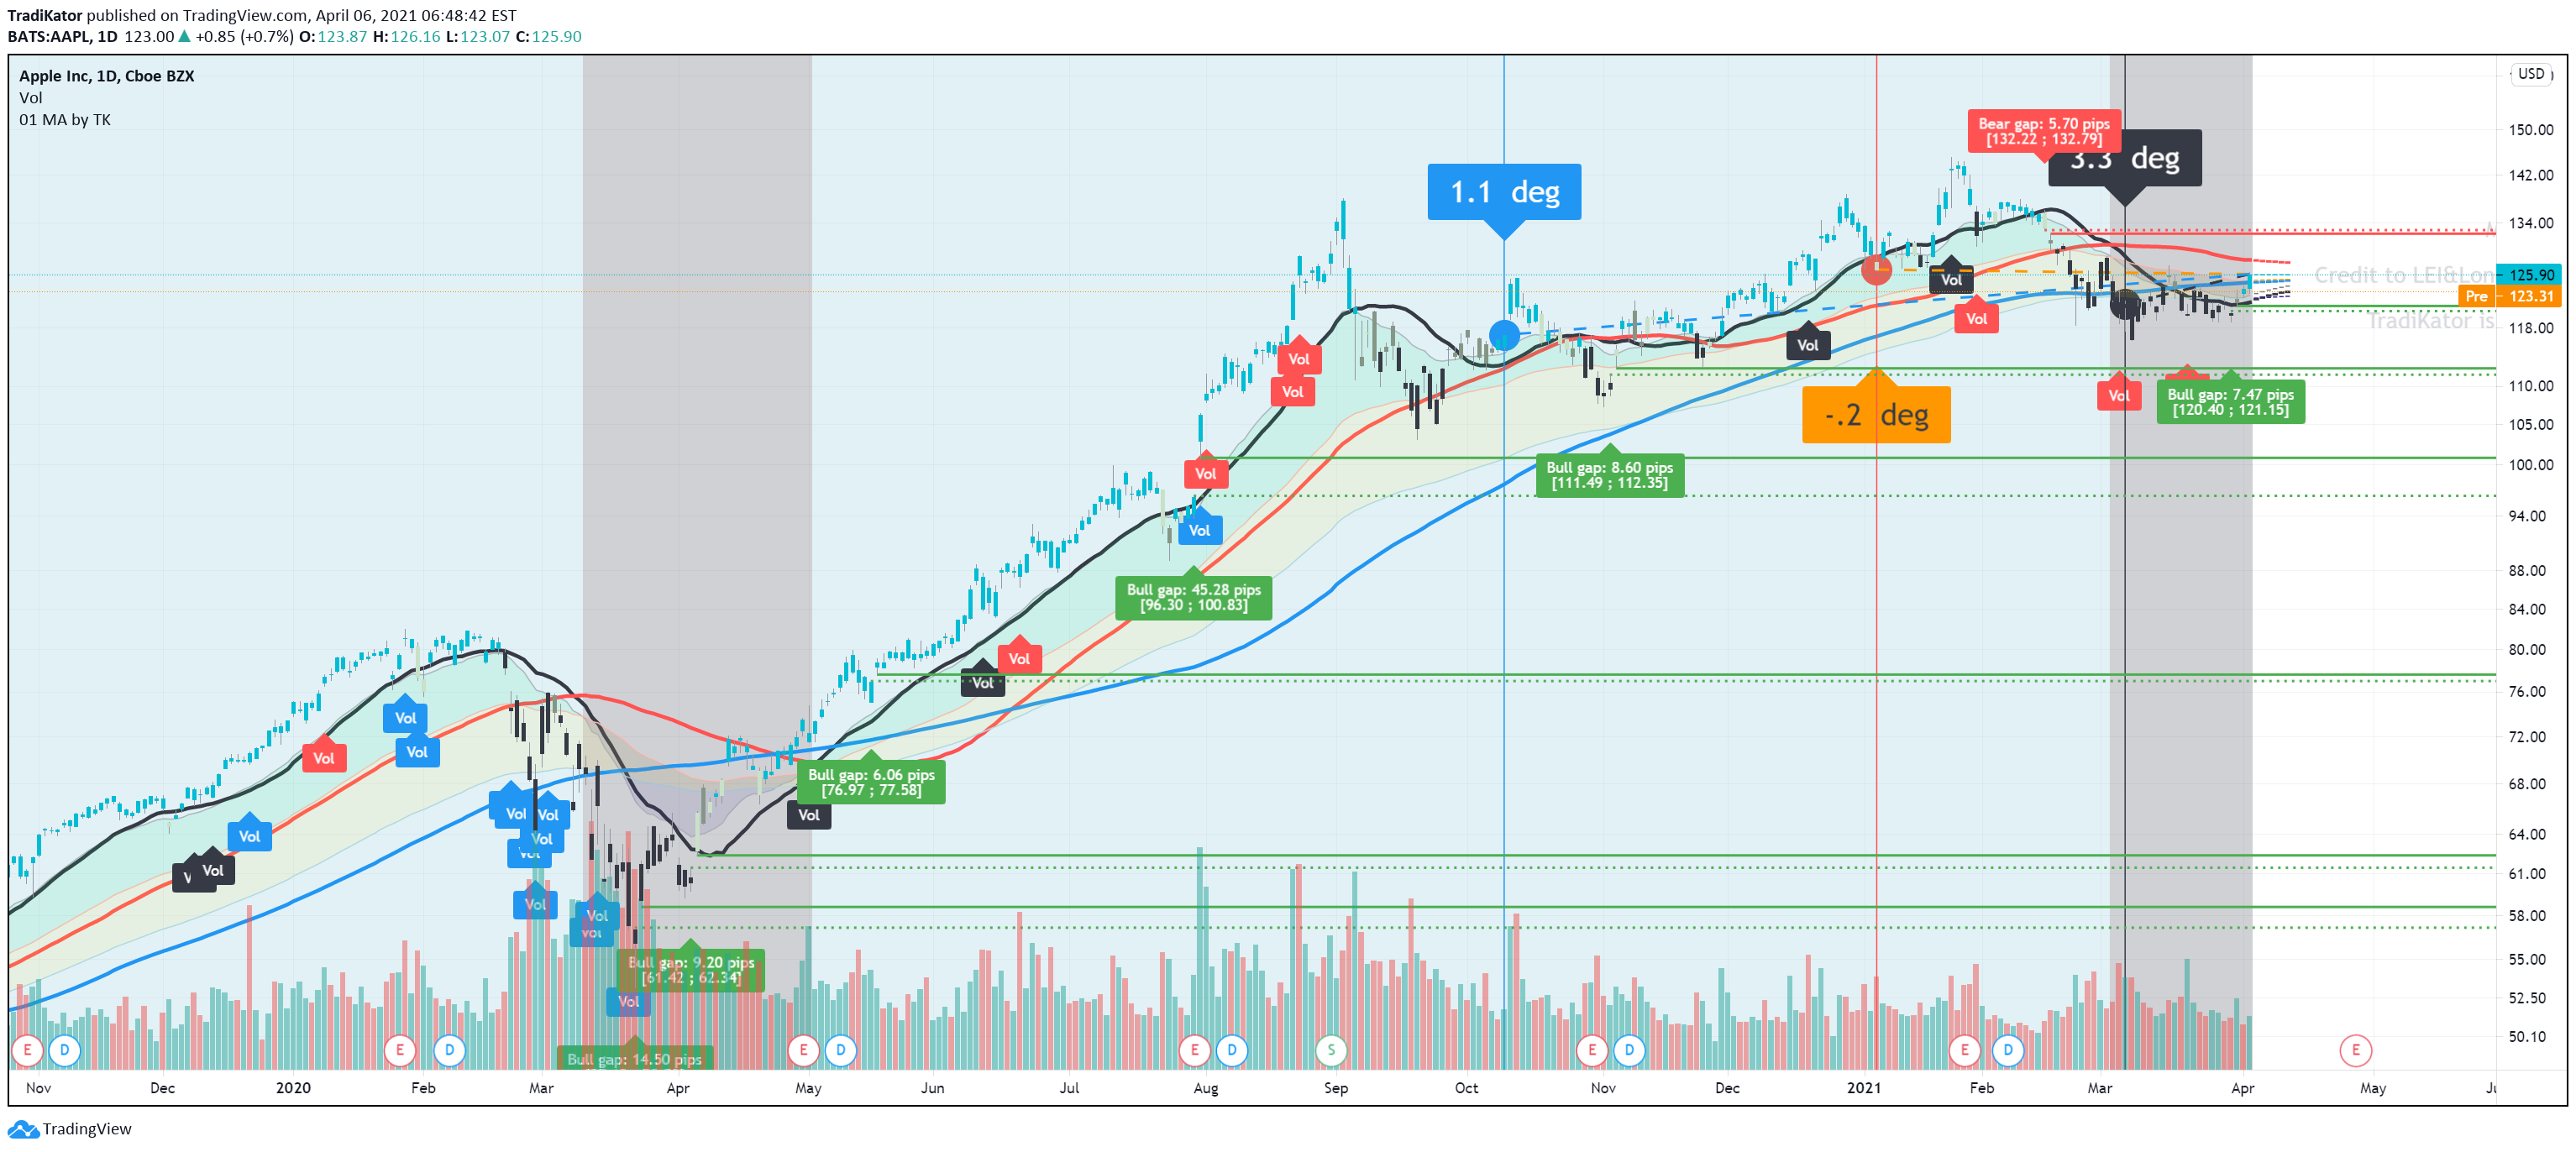
As LEI & LoneCapital explained current trend can be described as "o'clock direction wise". By measuring current trend's "angle" we can has a fuzzy image about current trend.

Note: In fact there is real 12 o'clock or 90 degree,
therefore we define our "90 degree" and all called value of "angle" is
based on our defined metric.
Also everyone has different opinion about the start point of current trend.
We choose the 3 MA periods as the start point to measure the angles.
There are 3 mod prepared for the angle measure metrology.
Abs % --> "90 deg" = increase 100% in 20 days.
Java
It is the most robust mod.
1Y rel % --> "90 deg" = increase 50% of 1Y Absolute price range in 20 days
Java
It can't be used in case of minus price.(like CL future in 2020 Mar)
1Y rel log --> "90 deg" = increase 50% of 1Y log scaled price range in 20 days.
Java
Also it can't be used in case of minus price.
Deduction price trail and Background color
•
"Show Deduction price trail"
Enable it to show the 3 Deduction prices' trail.
•
"Show trail in the coming days"
Enable : the prices' trail is showed in the coming days.
Disable : the prices'
trail is showed on the MA period historical days.
•
The percentile can be set by user. Also the MA period can be adjusted by user.
•
"Show gap"
Highlight the gap between close and next day open.
Note: We don't measure whether the gap is closed or not.
Green Dashed line: The close price according to the assumption user input.
•
Mod1: User should give the change rate in the coming every days. For example, user's assumption is that price will increase 10% everyday.
•
Mod2: User should give the future ?th days.
note: While using Mod2, user has to disable Mod1 by set Mod1 to 0 (default setting)
TradiKator is Traders' indicator.
Please visit TraiKator for more free script.
We also support Chinese.